Debugger embedding
April 30, 2011 Leave a comment
When one’s program crashes it can sometimes be difficult to find the matching symbols, source code and get hold of a debugger. One way to partially solve this problem is to copy your source code on a share and built against it, so that the source is always available from anywhere, but you will still have to get hold of your symbol files and find a debugger. The solution I came up with is a bit more extreme: package together the binaries, symbols, source code and the debugger! If the package can be organize so that at you can jump into the debugger any time without having to install anything would be even better. So let me demonstrate one way of doing this.
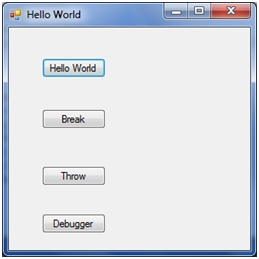
I will illustrate this with a Hello World application which will be used as the application to be debugged. The application will let the user
- Display Hello World
- Launch the debugger
- Break into the debugger
- Throw an exception
Debugger
So we will first need to find a debugger, luckily Microsoft have released the source code for the command line MDbg debugger. I don’t know of any other managed code debugger for which the source code is available, so I went with this one. Integrating it into our solution is then just a matter of referencing the binaries from our project, this way we can launch it from within our code. You can find the zipped Visual Studio 2010 project at the end of the post, which has all the source code minus MDbg.
ILMerge
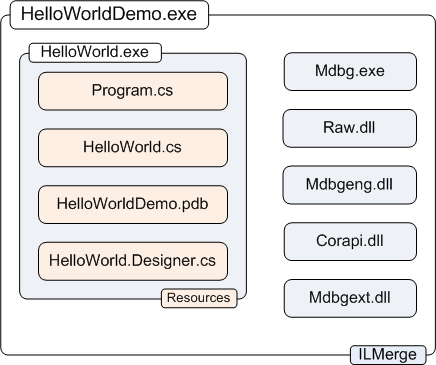
I usually don’t like my utilities to consist of more than a single executable file, so I often use ILMerge to combine all my assemblies into a single executable.
Source and symbols
The source and symbol files can be embedded into the executable as resources. That makes them easy to retrieve when required. The only downside is that we will have to build the project twice to be sure that Visual Studio includes the correct version of the source and symbols. I included the merging step with ILMerge as a post build step in the Visual Studio 2010 project. Note that ILMerge will even combine your symbol files into a single one. So this is the symbol file I included in the resources.
Launching the debugger
The next task is to hook-up the Launch the debugger button. The trick here consists in using our single executable to either launch the actual application or the debugger. This could be achieved with a command line argument, but there is a better way. If we assume that we will only ever launch the debugger from within our already running application (i.e. via the Lauch debugger button) we launch the debugger whenever the parent process is the application itself. When launching the debugger we can then just pass the PID of the parent process to get the debugger to immediately attach to it. Note that on Windows 7 and Vista the debugger will have to be executed with elevated privileges.
Passing symbols to the debugger
The last step consists in passing the symbol and source files we have embedded in our executable to the debugger when requested. For this I had to hack into the source code of MDbg. In MDbg all symbols files are loaded from the file system not by MDbg but by the actual core! That’s not too good as I would rather prefer not to have to write to the local file system. Luckily there is a way of passing a symbol file in a stream, but it’s a COM IStream… To use that I would have had to implement a wrapper around a .Net stream which would be a real pain. Luckily this is has already been done by others and it wasn’t difficult to find a fully implemented one (see the links section a the end of the post).
Passing source files to the debugger
This is much easier as the loading of the source files is entirely managed by MDbg. Here I just had to replace the code which reads the source files with code which retrieved the file from our main program.
The following diagram summarizes the packaging of the final application:
The demo
You will have to launch the HelloWorldDemo.exe binary as administrator if you are running Windows 7:
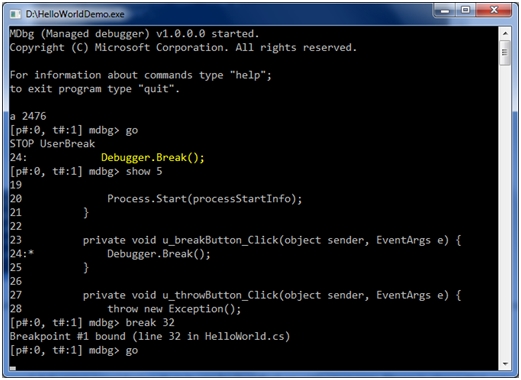
I first select to launch the debugger; this opens a new command line window with MDbg running which automatically attaches itself to the parent process. We are now in the debugger. At this point I keep the program running with a go command; this let’s me then click the Break button which breaks into the attached debugger. At this point I can for example look at the source code around my current location (show 3) and I can also set a break point (break 32) in the HelloWorld button event handler. I then let the program run again (go command). Here is a screen shot of the MDbg window after these operations
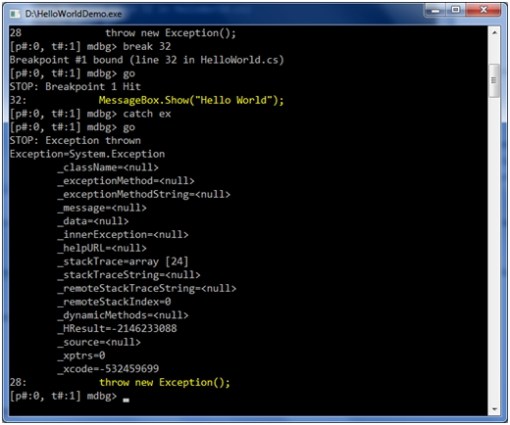
Clicking the HelloWorld button triggers the breakpoint. Now I configure the debugger to break on exceptions (catch ex) and let the program run (go). Next I click on the Throw button and we break in the debugger again:
This is a rather limited demo of MDbg; it’s a pretty good debugger considering that it can be bundled up with your app. There is also a GUI extension to MDbg, but I will leave this for another day. Finally note that the full program with the embedded debugger is now about 1.5Mbyte in size. Sounds quite large, but everything is in there, source code, symbols and debugger. By the way, MDbg also support edit-and-continue, I haven’t tried it, but this could transform this exercise in something close to a form of C# scripting.
Step-by-step
Let me give you some implementation details. As the project is available, I will only describe the modifications I had to make to the MDbg source code.
Firstly I added the following interface and static class to mdbgeng:
using System.IO;
namespace mdbgeng {
    public static class FileProviderHost {
        public static IFileProvider FileProvider;
    }
    public interface IFileProvider {
        string[] GetSourceFile(string filename);
        Stream GetSymbolFile(string filename);
    }
}
I also added to the same project Kornél Pál’s most useful wrapper class for the COM IStream interface. Make sure you #define NET_2_0 or remove the section for the .Net Framework 1.1 in the using section.
Modifying mdbg
For retrieving the source file you need to replace line 95 in Mdbg\SourceFile.cs with
    sr = mdbgeng.FileProviderHost.FileProvider
               .GetSourceFile(System.IO.Path.GetFileName(m_path));
We must also remove the calls to FileLocator.GetFileLocation, on line 360 in Mdbg.cs (comment out lines 360-368 and replace fileLoc by pos.Path), and line 840 in mdbgCommands.cs (comment out lines 840-844 and replace fileLoc by pos.Path)
Now for retrieving symbols files, in mdbgeng\Module.cs wrap up lines 247-248 inside the else branch of the following code:
    var filename = System.IO.Path.GetFileName(m_module.Name);
    var symbolStream = mdbgeng.FileProviderHost.FileProvider.GetSymbolFile(filename);
    if (symbolStream != null) {
        System.Runtime.InteropServices.ComTypes.IStream stream = new System.Drawing.ComIStreamWrapper(symbolStream);
        m_symReader = (SymBinder as SymbolStore.ISymbolBinder2).GetReaderFromStream(Importer.RawCOMObject, stream);
    } else {
        //lines 247-248 go here
    }
That’s all for MDbg.
You can download the attached zipped Visual Studio 2010 solution. You will only have to fix the references to mdbg and mdbgeng.
The test
You are now ready to try out your app. Beware that the debugger might be able to get hold of the symbol and source files independently of your hooks, so the best way to test the final binary is to run it on another machine.
Links
- MDbg download page
- MDbg links
- MDbg reference
- Kornél Pál’s IStream code
- ILMerge download page
- ILMerge homepage
Attachments
- HelloWorld.zip, disclaimer: this code is only a proof of principle and has not been tested beyond what I describe in this post!


