Memory benchmarks: Addendum tertium: the forgotten TLB
October 4, 2015 2 Comments
Obviously I have completely forgotten to consider the TLB. In Haswell processors, the L1 TLB contains 64 entries while the L2 TLB holds 1024 entries. All memory accesses must be translated from virtual to physical address, so every single read operation requires a TLB lookup. An L2 TLB miss implies retrieving the TLB entry from memory, so in the worst case a single memory read requires two (chained) memory accesses.
In .Net, page size is 4K, so 1024 TLB entries will cover only 4MB of memory. Remember that the benchmarks executed so far used 1 GB arrays, so in the case of random and chained memory accesses essentially all L2 TLB lookups should fail. But the access times observed don’t seem to exhibit such large delays. So what is going on here? The only explanation I have is that the L3 cache is actually holding all the TLB entries (this could be easily tested by disabling the L3 cache). On x64 a TLB entry is 8 bytes long, so a 25 MB cache will hold one eighth that many TLB entries covering at most 12.5 GB of memory. Hence, to feel the full effect of missed L3 caches we would have to work with arrays much larger than 12.5 GB. I added a few extra tests which deal with much larger arrays. Since I am using arrays of longs and in .Net arrays cannot have more than Int32.MaxValue elements, I have used an array of arrays of longs. Here is an extract of the code for a simplified version of chained reads:
var arrays = sizes.Max().EnumerateTo().Select(t => new long[max]).ToArray();
...
for (int i = 0; i < steps; i++) {
    next = arrays[i%size][(11587L*(i+next)) & mask];
    // first array should be retrieved from cache
    // integer division should be negligible
}
The loop for the random reads is the same except for the next variable not appearing on the right hand side.
Here are the results for the 8 cores machine with 30 GB of memory for chained readd:
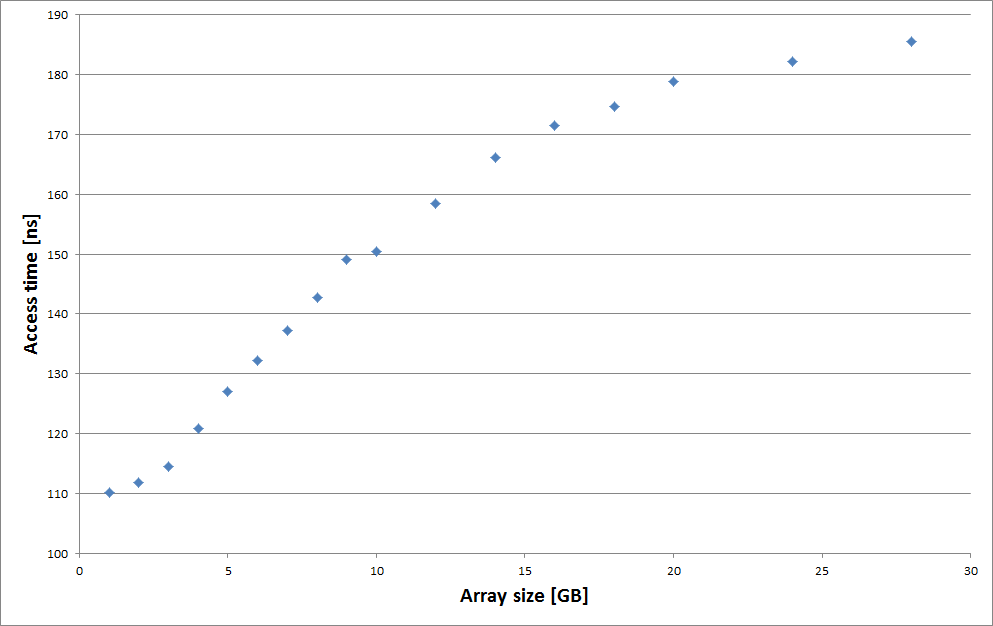
Well, the full impact of TLB misses is rather clear, memory access is gone from 110 ns to 185 ns and keeps increasing. Caches have become quite complex and I will not attempt to explain the results! Suffice to say that it exhibits a classic cache saturation curve. For 1GB arrays cache hit is close to 100% (1GB needs only 2 MB of TLB entries), while above 30GB cache hit will be close to 0% (30GB requires 60 MB of TLB entries). Maximum values will be somewhere around 190 ns or 200 ns, which corresponds to a doubling of the access time (allowing for 10 or 15 ns for L3 access).
The other case to consider is the random reads one:
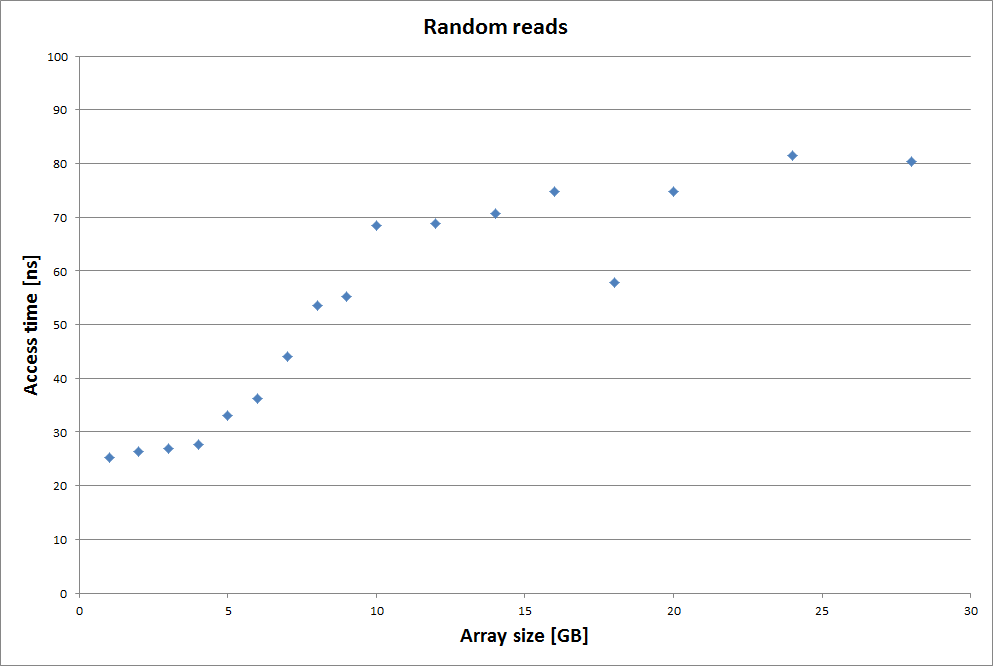
For random reads, the shape of the curve is very different… and frankly, I have even less to says 🙂 But a few things are worth mentioning. Firstly it seems to start flat which was not the case for the chained reads. Secondly it saturates at already 10 GB with a latency over three times the starting value, while one could expect the maximum latency to be twice that starting value.
Unsurprisingly there, array size has no effect on the performance of sequential reads. Note that it takes about 500 ns to read 4KB. In the worst case, adding a 110 ns delay every 500 ns would increase the average latency by 20 percent. In practice, subsequent TLB entries (assuming linear organization) should be prefetched, and hence have no impact.
So it looks like some of my previous results will not be applicable to very large data sets, so I better rerun my previous benchmarks on much larger arrays!
Bottom line is that for very large arrays the impact of TLB misses due to the tiny pages has a massive effect on latency. Best solution would be to use larger pages, but, sadly enough, that option doesn’t seem to be available in .Net.
[ 10 April 2016] I have updated some previous posts with the latest version of the benchmarks which now share a single 1 GB array to minimize the impact of TLB misses.

I don’t know if this is controllable by .Net, and my knowledge of Windows is zero, but what if you use this procedure (https://msdn.microsoft.com/en-us/library/windows/desktop/aa366720%28v=vs.85%29.aspx) and call your test from a script or C program stub?
It would be nice to repeat that experiment with and w/o large (huge in Linux 😉 pages.
Looks like it is hardcoded to the default in .NET 😦 I had a look at the source code of Core.Clr and can’t see any use of the MEM_LARGE_PAGE or MEM_4MB_PAGES flags. Being able to build the CLR means that someone brave enough could have a go at trying to change the default to use MEM_LARGE_PAGE.